GO-LAB
The aim of the Go-Lab Project was to facilitate the use of innovative learning technologies in STEM education, with a particular focus on online laboratories (Labs) and inquiry learning applications (Apps). Using the Go-Lab ecosystem, teachers could find various Labs and Apps, and add their own multimedia content to create tailored online lessons, or Inquiry Learning Spaces (ILSs). Furthermore, the Go-Lab Initiative conducted training for teachers on the topics of Inquiry-Based Science Education (IBSE), development of 21st-century skills, and the use of ICT and the Go-Lab ecosystem in the classroom.
Project Overview

Type
Rebranding while rethinking UX and UI.
Role: HCI Specialist, Participatory Design Team
Details
Methodology: Scrum.
Duration: 3 years, 2017-2019.
Tools: Figma, Balsamiq, Miro, Slack, React, Photoshop, GitHub, Power BI, SPSS, Nvivo, SurveyMonkey, REDCap, Mouseflow, Hotjar, etc.
Goals
- Assessing the platform's overall usability and user experience.
- Informing enhances to the interface and interaction designs.
-Creating new and improving on existing research.
Summary of Main Contributions
- Planned end-to-end research to inform decisions and drive the system's design and direction.
- Organized and conducted a variety of face-to-face events, remote user studies, and research-based analytical evaluations.
- Coordinated participatory design workshops with end-users across 18 European countries.
- Collaborated with the translation of user needs into requirements, prototypes and deliverables.
- Conducted iterative usability analyses of the existing tools available in the platform.
- Coordinated new and re-designs with developers, educators and product owners to collaboratively impact the overall user experience.
- Developed a few plug-ins or "learning apps".
Case #1
Gathering user feedback and requirements from participating end-users in 18 European countries.
The Solution
An average of 25 sessions were conducted for this purpose, each year for the duration of the project. Some studies collected longitudinal data from hundreds of teachers and students in over 15 countries.
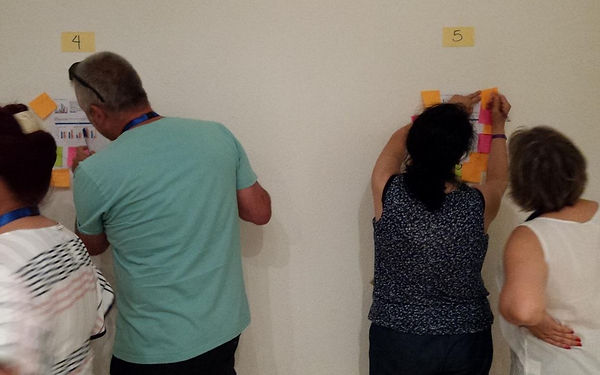
User-based evaluations were of two types: face-to-face events or remote studies. While face-to-face activities enabled us to capture rich data from end-users, we were also able to obtain faster feedback on some partly formed ideas or work-in-progress using computer-mediated communication (CMC).
Typical HCI methods, such as tree and concept testing, observations, questionnaires, card sorting, and moderated group discussions were prepared and used for our face-to-face events.
Remote activities were conducted through software-supported tools. End-users (mostly teachers) were given specific tasks to complete, assessing their perceptions and experience with a variety of tools, including surveys, standardised scales, click testing, heatmaps, and A/B testing.

The flexibility that asynchronous remote studies provided – no geographical or temporal barrier – encouraged teachers to get involved more easily. Nonetheless, a limitation of this remote approach was the fluctuating response rate, depending on the teachers' workload, for example.
Case #2
Analysing the extensive data collected from face-to-face and remote evaluations with end-users.
The Solutions
User-based sessions mainly seeked to fulfil one (or more) of the following pursposes:
-
To test developed system components for usability, user experience and whether they provide valued functionality;
-
To assess teacher and student acceptance and engagement with aspects of the system, or system concepts;
-
To verify or challenge working assumptions;
-
To provide additional design ideas or to evaluate early design ideas using mock-ups and prototypes.
The qualitative and quantitative data collected during end-user evaluations and experiments was organised and analysed depending on the specific needs and research questions of each session.
Qualitative data was transcribed, organised, and coded to identify keywords and patterns. Tools like affinity diagrams, data visalizations, sentiment analysis and clustering were useful for this effect. Software such as Microsoft Excel, ATLAS.ti and NVivo helped with this qualitative analyses of user responses.
To analyse quantitative data, we followed guidelines of standard methods for descriptive, inferential and correlational analyses. The data was firstly organized and cleaned, then analysed with software such as SPSS, Microsoft Excel and Power BI.

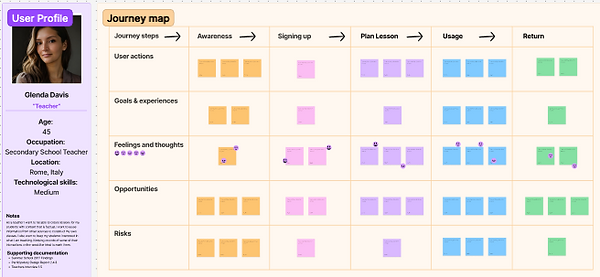
Various means were used to convey these findings to the different interested parties (e.g. developers, product owners, policy makers). For instance, by writing documentation, creating assorted charts and graphs, constructing user personas and scenarios, structuring user journeys, or designing prototypes.
Case #3
Evaluating the usability of old and new features with a research-based analytical evaluation approach.
The Solution
Research-based evaluations seeked to identify significant issues with the system prior to testing it with end-users. In following this practice, a team of usability specialist performed Heuristic Evaluations on several artefacts, which were subsequently evaluated with end-users where applicable.
We conducted expert inspections and end-user evaluations to guarantee an optimal usability of the different sections of the platform, as well as any new features or gadgets to be included in it. Reports of these assessments were periodically sent to the management and development teams to inform the need for any improvements.
The general process followed in these studies was as follows: HCI specialists performed common interactions and inspected the different screens to check for any usability issues or bugs. Several tasks and sequences were tried out to ensure the correct performance of the tool under different circumstances. Two
approaches to exploring the artefact were used:
-
screen driven – i.e. based on what could be seen, and
-
process driven – i.e. based on assumed end-user goals and how a user would try to achieve them.
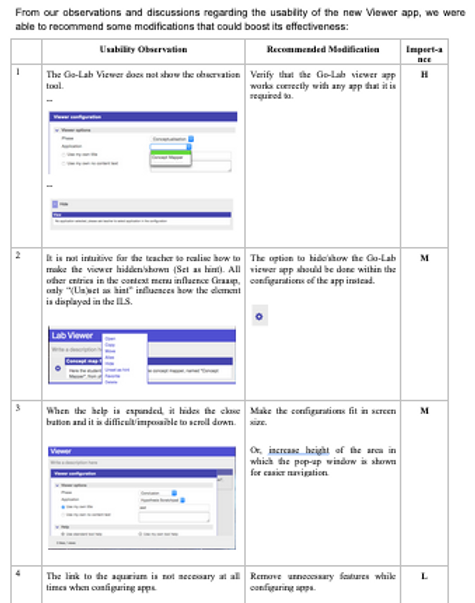
Observations made during the analytical walkthrough were documented. After the session, the usability observations were circulated around the team so that all could independently assign importance levels (H - high / M - medium / L - low) for fixing each
issue. Finally, discrepancies in importance were discussed and consensus was achieved for each observation. This resulted in a table of usability observations and recommended modifications with importance ratings (see Table above for an example).
Case #4
Updating the looks of the entire platform.
The Solutions
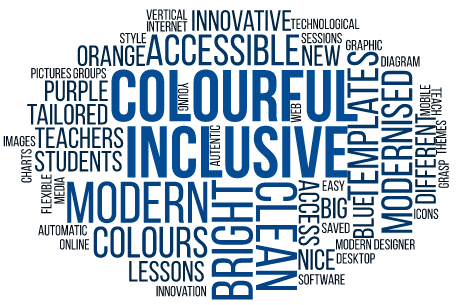
Following the advice of a sizeable sample of end-users over three face-to-face events and two remote studies, the colour style of the whole system was changed to a more vibrant palette.

We also redesigned the looks of the authoring platform using new programming technologies (e.g. React) and based on quality standards (e.g. accessibility).


